

Table of Contents
Introduction
“Who can relax at home and not panic in COVID-19?”
“Is there a simple number that can be used to identify which of the COVID-19 infected patients will NOT develop complications and will NOT require additional support?“
A recently conducted survey shows that this is a burning issue in today’s pandemic haunting everyone.
It’s clear that COVID-19 infection can’t be really stopped. One wave after the other have been raging across the world and will continue. It’s really terrifying. But we also know that majority recover easily. Only a few require hospitalization. Despite this fact, each wave of this pandemic overloads the existing healthcare systems with hospitals running out of beds.
At present there is really no way to predict right at the start which patient infected with COVID-19 will develop complications. If such prediction is made possible, we shall be able to focus our resources on only those who really need, and decisively intervene at a very early stage- while other patients might just relax at their homes. Such early intervention focused on the ones who will eventually develop complications on COVID-19 infection will significantly reduce hospitalization rate and mortality. But is there a way to accurately predict which patient will deteriorate and will require such early intervention?
This is exactly what we will try to answer. Let’s see if we succeed.

This post is the fourth and the last part of the four-parts series that intends to eventually show how we can easily predict outcomes of COVID-19 infected patient at a very early stage.
(If you haven’t read the first three parts, I will strongly recommend doing so. For the first part, click HERE. For the second part, click HERE. For the third part, click HERE)
What will we learn in this post?
In the first part of this series we focused on understanding why it is more important to predict who will die in COVID-19 rather than just focusing on prevention and treatment of all. We also explored how vaccines and anti- viral drugs might not help in completely wiping off this pandemic. In the second part, we explored the basics of immunology behind “COVID-19 induced cytokine storm”, which is real of cause of death in majority. In the third part we thoroughly investigated how a healthy immune system prevents cytokine storm and understood the defects in immune system of few people that make them unlucky enough to suffer from this horrific complication of COVID-19 infection.
In this post, we will finally try to arrive at a simple scientific way to predict “Who can relax at home and not panic in COVID-19?”
Armed with the basic knowledge you gathered in Part 1, Part 2 and Part 3, this post should be extremely simple to follow. Anyways, I will be using very simple language such that every reader, irrespective of his/her background will easily understand. Hopefully after that, if you see a patient infected with COVID-19 you might have a way to predict if he/she will deteriorate and require hospitalization.
Who will die? Solving the confusion
Immunosenescence: the main culprit- Can it be measured?
We can now appreciate what’s going on around- why few unlucky people succumb to Covid-19 infection. We have conclusively identified in the earlier parts of this blog series that lack of enough number of “trained T cells” is the true cause behind the killer cytokine storm that kills a patient of COVID-19.
Based on this available knowledge, the logical next step is to correctly identify these individuals around us who suffer from this scarcity of mature T cells and focus all efforts to prevent Covid-19 in such individuals. Further, if we can identify such individuals, we will know who will need critical care in case infection happens. This will help channelize resources in the right direction and prevent deaths.
But how can we identify who has critically low number of mature trained T cells?
To be fair, almost 4 decades of research has gone into understanding this immunologically critical state, which is popularly known as a state of immunosenescence. Immunosenescence refers to aging of immune system. This “immune- aging” might happen naturally as we age or might result from chronic state of inflammation such as uncontrolled diabetes mellitus (experts also this as “inflammaging”) [1] [2]. Hundreds of studies have now established patterns to identify this state of “critical” immunosenescence which can help us identify these “at risk” individuals with critically low number of trained T cells [3].
To understand and make sense of these patterns we will have to dissect the family of T cells a bit and understand them.
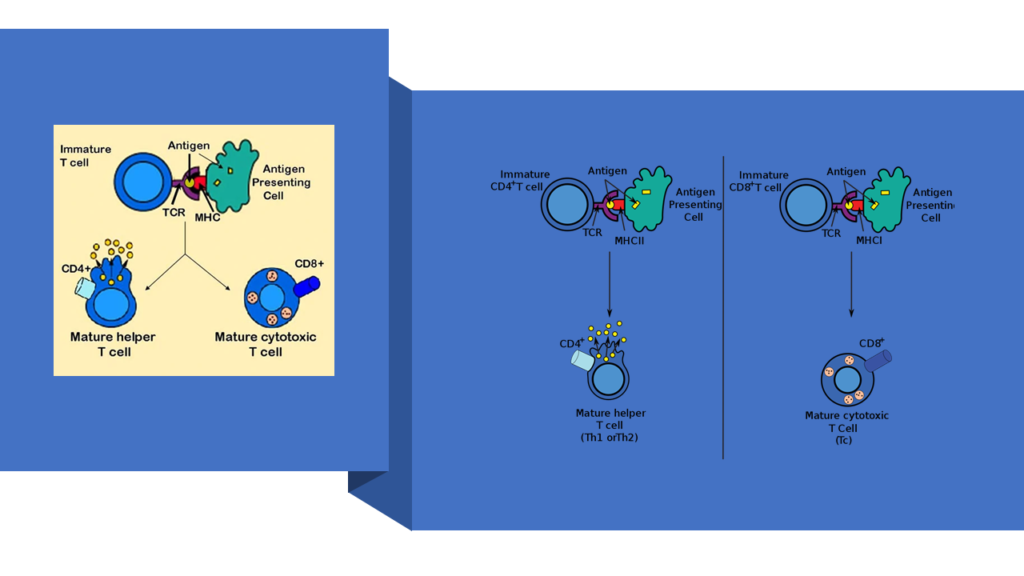
There are many types of T cells inside our body. Each type has a specific biological signature and well-defined functions. And I won’t dare to bore you with details of each type. What’s important for us to know is that of these many types, there are two predominant ones. One is marked by signature called CD4 and the other one is marked by CD8. If the signature is present you mark it as + or else, you will mark it as -. So, CD4+ T cells would mean T cells bearing signature of CD4. Similarly, CD8- T cells would mean T cells NOT bearing signature of CD8. Hope the nomenclature is clear.
CD4+ T cells are also known as helper T cells. CD8+ T cells are also known as cytotoxic T cells. While understanding the details will require a great deal of training in immunobiology, what you can generalize is that CD8+ T cells are designed to attack and destroy cells that pose as threats. For example- tumour cells, cells harbouring viruses etc. They, along with components of innate immune system, directly kill cells bearing pathogens within them. CD4+ T cells are designed to target pathogens that roam outside the cells. So, a bacterium or a virus that has been released from a cell will be targeted by CD4+ T cells. CD4+ T cells primarily do not kill self- cells harbouring viruses– that’s the role of CD8+ T cells [4].
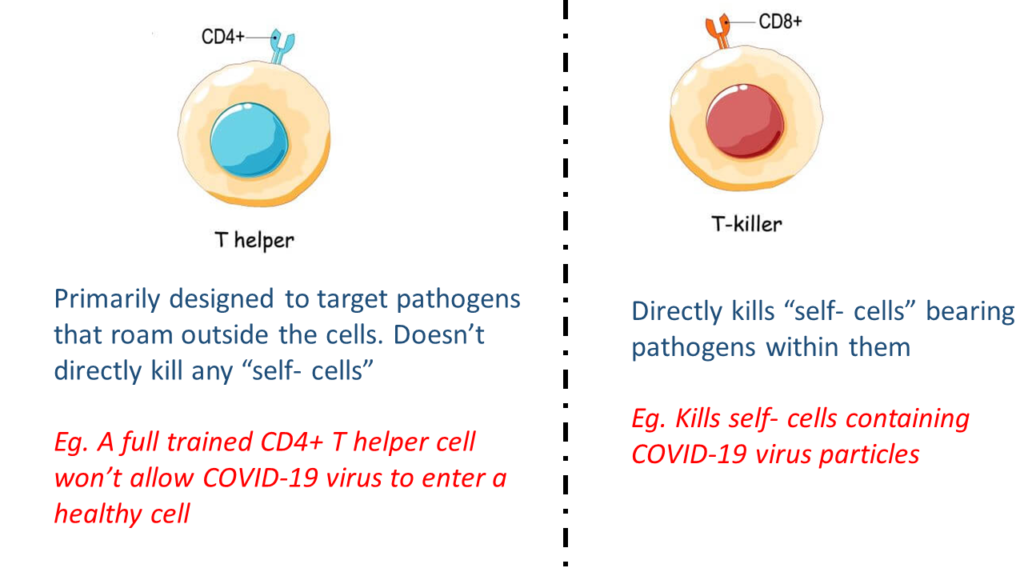
(To be honest, this is a very simplified version of the story. In reality, components of immune system are interdependent, and their individual roles can’t be delineated just like that. For example, the Th1 component of CD4+ T cells do contribute to direct killing of “self- cells” bearing pathogens. However, for the sake of simplicity, you can consider that killing “self- cells” bearing threats directly is generally done by CD8+ T cells [5].)
Now, in a healthy immune system with enough “trained” T cells, CD4+ T cells are more numerous than CD8+ T cells. And that’s simply because in thymus the training is all about being tolerant to self-cells. Since CD8+ T cells are technically meant to destroy self-cells, many fail to clear the tests posed by Thymus. Eventually, we end up having higher number of trained CD4+ T cells compared to trained CD8+ T cells.
But if Thymus fails to replenish the growing need to supply new T cells, maybe due to aging or maybe due to chronic immune stimulation or maybe both, the body ends up having a surplus of untrained T cells. In absence of right training, the focus becomes only tackling the threats. These threats are generally from “self-cells” (eg. deranged cells due to onslaught of product of sugar in case of diabetes or cells harboring Covid-19 virus), which must be tackled by CD8+ T cells. So, in an aging immune system one will have more of CD8+ T cells.
(For GEEKS: these CD8+ T cells will also be mostly CD28-. This means they get activated without requirement of any co-stimulation. Other readers may ignore this comment!)
How to Predict: Who can relax at home and not panic in COVID-19?
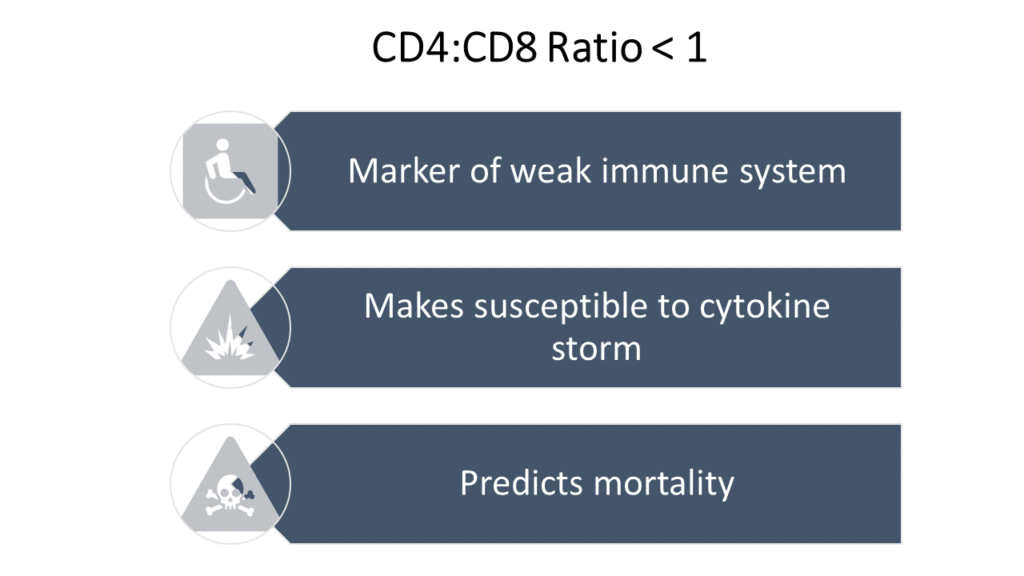
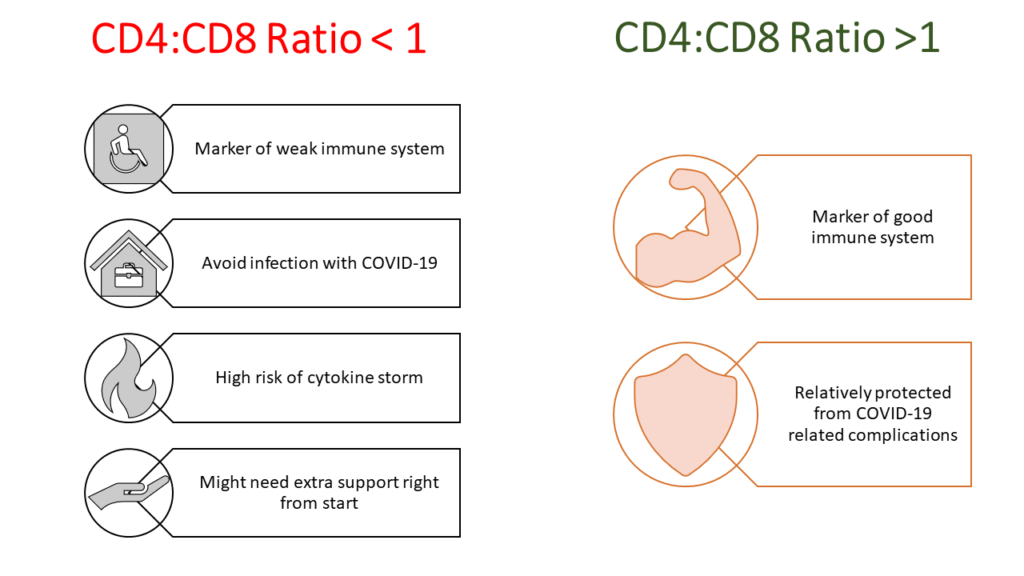
It is this reversal of CD4:CD8 T cell ratio that has been consistently noted, amongst many other markers of “dangerous” immunosenescence”. This has been famously called as immune risk profile (IRP) and is defined as CD4/CD8 ratio < 1 [6]. If we consider all the points we have discussed till now, and correlate them with this concept of IRP we should be able predict a few outcomes. For example:
- IRP (defined as CD4/CD8 ratio < 1) should correlate with age. As age increases IRP should become evident.
- IRP should get triggered with CMV infection (refer to the third part of this blog series)
- IRP must predict mortality
- IRP must be able to predict who will face cytokine storm when infected with Covid-19
The first 3 points have already been proven convincingly in several studies. Let me give examples of the classical studies done by Swedish scientists [7]. The first study is known as OCTO [8]. And the second study is known as NONA [6]. Both the studies aimed to understand immune system of people whose age crossed 84 years. Swedish scientists did not restrict their research only to extremely old individuals. Their aim was to eventually evaluate changes in immune system across adult life span. HEXA study and Kristianstad Survey focused on younger populations [9]. Altogether, the studies evaluated individuals with ages spanning from 20 to 94 years.
All these studies conclusively showed that IRP predicted survival and age [9] [6] [8]. Sensitivity of CD4/CD8 inversion in predicting mortality is very high. Interestingly these predictions using CD4/CD8 ratio were not related with health condition of individuals. What it means is if one has IRP (i.e. CD4/CD8 <1) the chances of survival is very low even if that individual looks physically fit, while if someone doesn’t have IRP (i.e. if CD4/CD8 ratio is NOT <1), the chances of survival is very high although the individual might be suffering from a disease. IRP has also been convincingly proven to be correlated with mortality.
The findings were not limited only to Sweden. The scientists from Cambridge University, UK also came with very similar findings in their 2003 study [10]. CD4/CD8 ratio predicted survival and mortality in their patient population as well- when the ratio went <1, survival went down.
Swedish studies also show that CMV infection correlated strongly with IRP. From whatever we have discussed till now in this series of four posts, a rapidly proliferating long standing viral infection such as CMV can easily drive IRP in any individual by inducing rapid proliferation of CD+ T cells
We can now conclude scientifically that with age CD4/CD8 ratio keeps falling. In fact, if you somehow manage to prevent this ratio from falling, most probably you will live quite long. People with survival to the age of 100 years have shown a stable high CD4/CD8 ratio. But, for most, this ratio keeps falling with age.
Now try to link this knowledge about IRP with whatever we have learnt till now about the cause of COVID-19 led cytokine storm. I can simply hope that you will naturally come to the direct conclusion that I have reached- that IRP can be used to predict who might progress into cytokine storm if infected with COVID-19.
IRP indicates immunosenescence (aging of immune system) of critical level. Individuals with IRP (CD4/CD8 ration <1) have immature immune system. This immature immune system, when faced with the wrath of COVID-19, can easily turn into psychopathic killers killing not only the virus but also all the surrounding “self- cells” leading to the deadly cytokine storm.
Experts in this field have already recognized immunosenescence as predictor of cytokine storm in COVID-19. But, I do understand that this needs to be proven via clinical studies. I hope I have built a strong case to put forth CD4/CD8 ratio < 1 as the marker to identify individuals who might be at high risk of complications if infected with Covid-19.
CD4/CD8 ratio is a fairly common test. It is common done to predict survival in HIV+ patients. It has been long known that as CD4/CD8 ratio falls in HIV positive individuals, chances of death rise furiously. It easily available in all laboratories. In India the test cost ranges from INR 400 to INR 1200 depending on the lab. If we know an individual’s CD4/CD8 ratio, it seems we can predict whether he/ she will need extra care in case he/she gets infected with COVID-19.
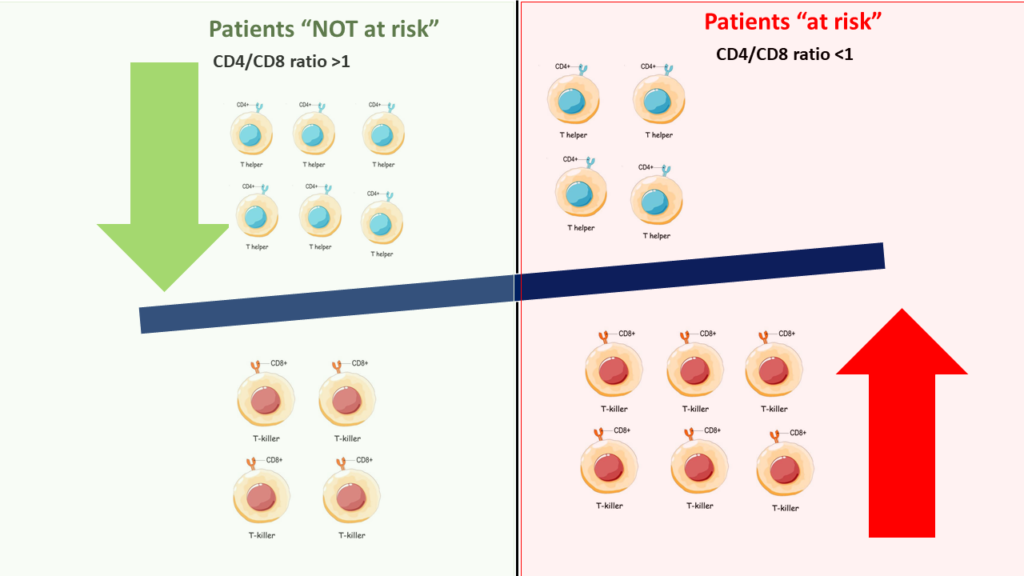
Best thing is (if proven), its just one test, easily available and can be used as a predictive marker at a very early stage of infection. Infact, if you don’t have IRP (I.e. your CD4/CD8 ratio is >1), you really won’t have to fear getting infected with COVID-19. If you do have IRP, you are the one who should avoid venturing outside, take every precaution to prevent any infection, and be marked for hospitalization if infected with COVID-19.
Hence we really need to test this predictive role of IRP via good clinical studies.
Are there any prediction tools currently in use?
The issue that we are trying to resolve is a cause of great concern globally. Early identification of patients with COVID-19 who are at high risk of mortality is of vital importance. Lot of researchers across the world are trying to solve this. As hospitals around the world are faced with an influx of patients with Covid-19, clinicians agree that there is an urgent need for a pragmatic risk stratification tool that will allow the early identification of those patients who are at the highest risk of death, to guide management and optimize resource allocation.

More than 20 such different predictive tools have been developed and validated till date. Few are useful. Few are just academic exercises. I won’t go through all of them but let me quickly cover a few important ones which do have potential use.
- The first one came from the Chinese team of Jiao Gong et al in April 2020 [11]. This Chinese Covid-19 risk prediction nomogram integrated 7 values including age, LDH, CRP, DBIL, RDW, BUN and ALB. I won’t make it more complicated for you, but the accuracy of this tool was between 75- 80%. You will go wrong more than 20% times with this tool. And, this tool can be used only for hospitalized patients.
- In May 2020 Chinese scientists from came up with a predictive tool based purely on clinical findings [12]. I particularly liked this tool. Without doing any laboratory tests, just by examining a COVID-19 infected patient, a physician can determine what is the risk of the patient progressing into a severe disease. There are few critical challenges here: you can determine risk only once the patient has developed infection and hospitalized with it. Next, the symptoms vary over a period of time and depends on when the patient is coming to doctor. So, a patient will have to be in continuous touch with the physician and the physician will have to continuously recalibrate this tool. Lastly, the tool just gives probabilities. Ultimately, it’s a judgement call of the physician.
- In June 2020, physicians from New York launched a “COVID-19 survival calculator” [13]. But again, this calculator can be used on in hospitalized patients. This tool is claimed to help predict 7-day survival in patients hospitalized with COVID-19. The tool [14] is freely available here: https://cbmi.northwell.edu/nocos/
- Artificial intelligence and machine learning can find patterns which might be difficult to discern manually. In July 2020, using AI led radiomics, Chinese researchers developed a predictive nomogram. This AI based tool can used to predict severity using radiological changes in lungs due to COVID-19 infection [15].
- In Aug 2020, the Dutch scientists came up with a prediction model [16] to determine which hospitalized COVID-19 patients might deteriorate and proceed to ICU. This model consists of a combination of clinical, laboratory and radiological measures. Readers interested in using this tool can access the same by clicking here: https://docs.google.com/spreadsheets/d/1eFrdHxnOA-M_P-ijxnC2u30qk7IhMVV6YvHvJhrZ8Ws/edit#gid=0
- Similar calculator for hospitalized patients for developed by the Chinese team in Aug 2020. It is called COVID-GRAM [17]. This too consists of a combination of clinical, laboratory and radiological measures. Readers interested in using COVID-GRAM can access the same by clicking here: http://118.126.104.170/
- In October 2020, Chinese researchers came up with another early warning nomogram to predict risk of deterioration in hospitalized COVID-19 patients [18]. This tool also is quite useful with decent prediction capability.
- Researchers at Mount Sinai, New York have developed machine learning driven severity prediction tool [19] . This tool makes predictions about the hospital course of the patients based on patient characteristics at admission.
- Chinese researchers have also come up with another machine learning led predictive tool for prediction of adverse clinical outcomes in hospitalized patients with COVID-19 [20]. It’s also quite accurate with good predictive power.
- In March 2021, John Hopkins University revealed SCARP [22]. SCARP is the acronym for Severe COVID-19 Adaptive Risk Predictor. It’s a calculator to predict severe disease or death in hospitalized patients with COVID-19. It’s an interactive calculator that rapidly and accurately provides the probability of an individual patient’s progression to severe illness or death on the basis of readily available clinical information. Interested readers can access this calculator by clicking here: https://rsconnect.biostat.jhsph.edu/covid_trajectory/
- In Aug 2020, top researchers from Cleveland Clinic came up with superb calculator that allows a doctor to calculate the risk of hospitalization in COVID-19 infected patients [24]. It does need a few lab reports to ensure its predictive power. Nevertheless, it is also a useful tool. You can access this calculator here: https://riskcalc.org/COVID19Hospitalization/
- In September 2020 ISARIC team from WHO published a fabulous risk calculator to predict mortality in patients admitted to hospital with COVID-19 [23]. Known as “4C Mortality Score”, this is a very efficient predictive tool (one of the best out there) and one can access the same by clicking here: https://isaric4c.net/risk/v2/
- Lately, in April 2021, Korean scientists published COVID-Mortality Score [25]. It’s an online open access calculator that can calculate the chances of a patient dying who is hospitalized due to COVID-19. This easy to use calculator can be accessed by clicking here: https://www.diseaseriskscore.com/index_pc.html
- In Aug 2020, scientists from China and US collaboratively published a simple nomogram to predict the death probability of patients with COVID-19. This nomogram, called ANDC score, is based on just 4 parameters [26]. Its simple and easy to use. But again, on needs to keep revisiting as the lab values change with disease progression. And this reiteration process can pose burden on the diagnostic infrastructure.
- On similar lines, in April 2021 Chinese investigators came up with another simple nomogram that uses just 4 parameters to predict which patient infected with COVID-19 will deteriorate and require critical support [27]. Only using WBC, CRP, lymphocyte count and LDH, the tool is able to make quite accurate predictions about patient’s future course of clinical progression.
If you have read this section closely you will agree with following observations regarding the predictive tools we have discussed in this section:
- Most of the tools can be used only in patients who are already hospitalized.
- Many of these tools require extensive number of tests to improve power of prediction, which will only increase pressure on an already fragile healthcare system.
- These predictive nomograms are based on several clinical symptoms and investigation reports. We know that the symptoms and findings of investigations for any patient keeps varying over a period of time and they also depend on when the patient is coming to doctor. So, a patient will have to be in continuous touch with the physician and the physician will have to continuously recalibrate any such tool he is using.
- Accuracy of these tools are not 100%. Many have around 80% accuracy which means your prediction might go wrong for every fifth patient you see.
- Lastly, the above tools just give probabilities. Ultimately it’s a matter of physician’s judgement. So, what should a physician do if the tool says that a particular COVID-19 patient has 40% probability of developing complications (and let’s say the tool itself is around 80% accurate!)?
We need a predictive tool which can be used in all patients. We need a tool which can be used to predict outcomes even if before anyone is infected COVID-19. The tool has to be simple- maybe just 1 single test. And we need a tool whose prediction is binary- it should answer either YES or NO to the question- will this individual progress into severe stages on infection with COVID 19?
IRP (CD4/CD8 ratio < 1) seems to be the answer.
Final comments
Covid-19 will not be the last biggest pandemic. Many more will come- bigger ones. Humanity will continue to prevail. Most will survive such pandemics. But few will succumb. This “few” succumbing will number in millions. Hence, we must have something which will say who will face this eventuality. Because, without this information, a similar number or maybe more will die because of economic ramifications of stringent measures such as lockdowns.
CD4/CD8 ratio < 1, also known as IRP, might prove to be simple test to predict which of us might require critical support if infected with COVID-19. Similarly, if someone’s CD4/CD8 ratio is >1, he/she may be least likely to develop any complications.
Heath authorities must quickly identify the importance of this simple marker of complications in Covid-19 and must design studies to verify predictive role of IRP. If IRP stands the test of clinical studies, we will end up saving millions of lives- lives that might get lost not only due to Covid-19 but any other viral infection that kills via cytokine storm.
IRP (if proven) will simplify the current complicated life in COVID-19. If I don’t have IRP (i.e. my CD4/CD8 ratio is >1), I won’t care about infection with COVID-19. I know I will recover easily even if I get infected. If I do have IRP (i.e. my CD4/CD8 ratio is <1), I will be super careful. I will avoid venturing outside, take every precaution to prevent any infection, and be prepared for hospitalization if infected with COVID-19.
Health authorities can group populations into two- those with IRP and those without IRP. Based on this data, resource requirements can be predicted and planned. The current situation of unnecessary fear and panic can be calmed down. Doctors will then know who will really need hospitalization and who should be send home to relax.
I would end this long 4- posts series by repeating once again that use of IRP as a predictor of complications in COVID-19 needs to be tested and proved before actual clinical usage. But this should be done as a priority. It can solve the current crisis of needy patients standing in long queues and not getting beds in hospitals.


This is great simplified explanation form for even layman to understand….Thanks Subir for the effort
Thanks Vinodji!
I have read your article carefully and I agree with you very much. This has provided a great help for my thesis writing, and I will seriously improve it. However, I don’t know much about a certain place. Can you help me?
I have read your article carefully and I agree with you very much. This has provided a great help for my thesis writing, and I will seriously improve it. However, I don’t know much about a certain place. Can you help me?
Your article gave me a lot of inspiration, I hope you can explain your point of view in more detail, because I have some doubts, thank you.